Debugging
There are a few ways to debug the Anonlink Entity Service, one of the easiest ways is using docker-compose to take care of all the dependant services.
Debugging in PyCharm
Roughly following the JetBrains tutorial <https://www.jetbrains.com/help/pycharm/using-docker-compose-as-a-remote-interpreter.html> will work with one deviation. Before debugging, launch the nginx service manually from the docker-compose.yml file.
The following steps through this process using PyCharm 2020.
Debugging an Anonlink endpoint in PyCharm
Add Python Interpreter
Start by adding a new Python interpreter. In new versions of PyCharm look for the interpreter down the bottom right of the screen.
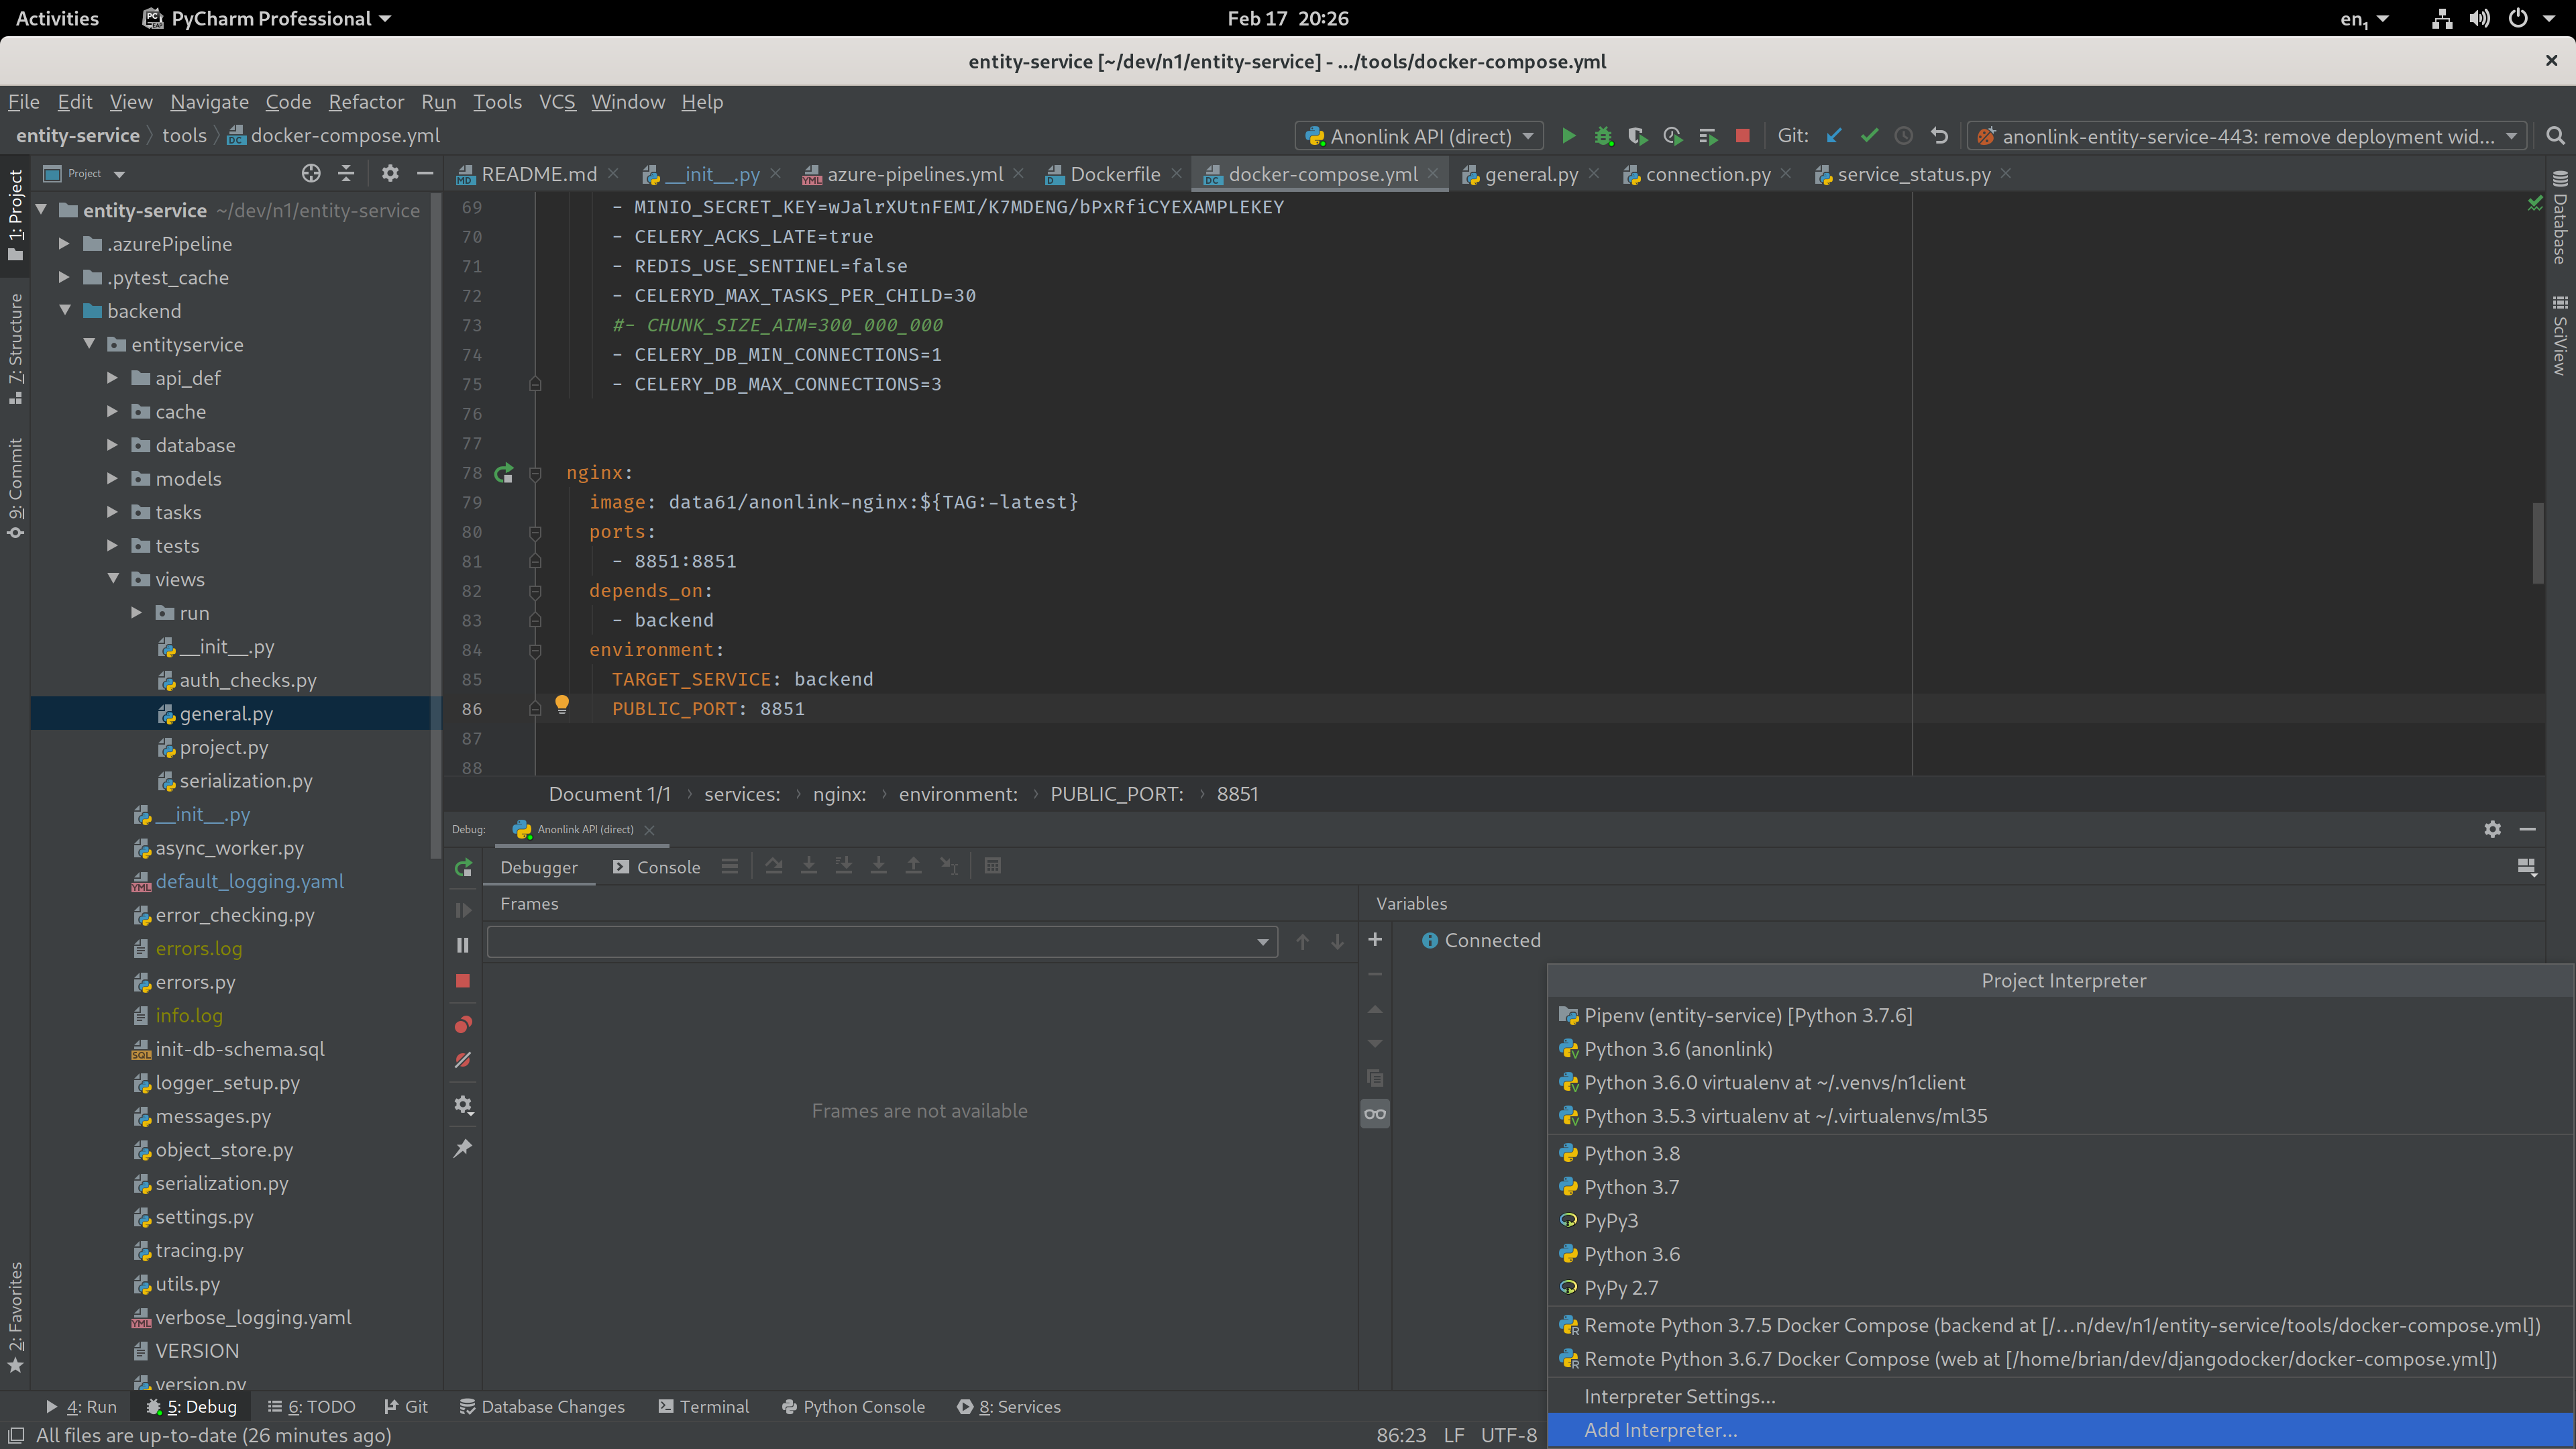
Choose Add Interpreter
Make a docker-compose interpreter
Adding a Python interpreter from a docker-compose service is straightforward.

Enter the tools/docker-compose.yml path for the configuration file and
select backend as the service.
Manually start nginx
Because the Anonlink Entity Service has an nginx container
in-front of the backend api we manually start nginx.
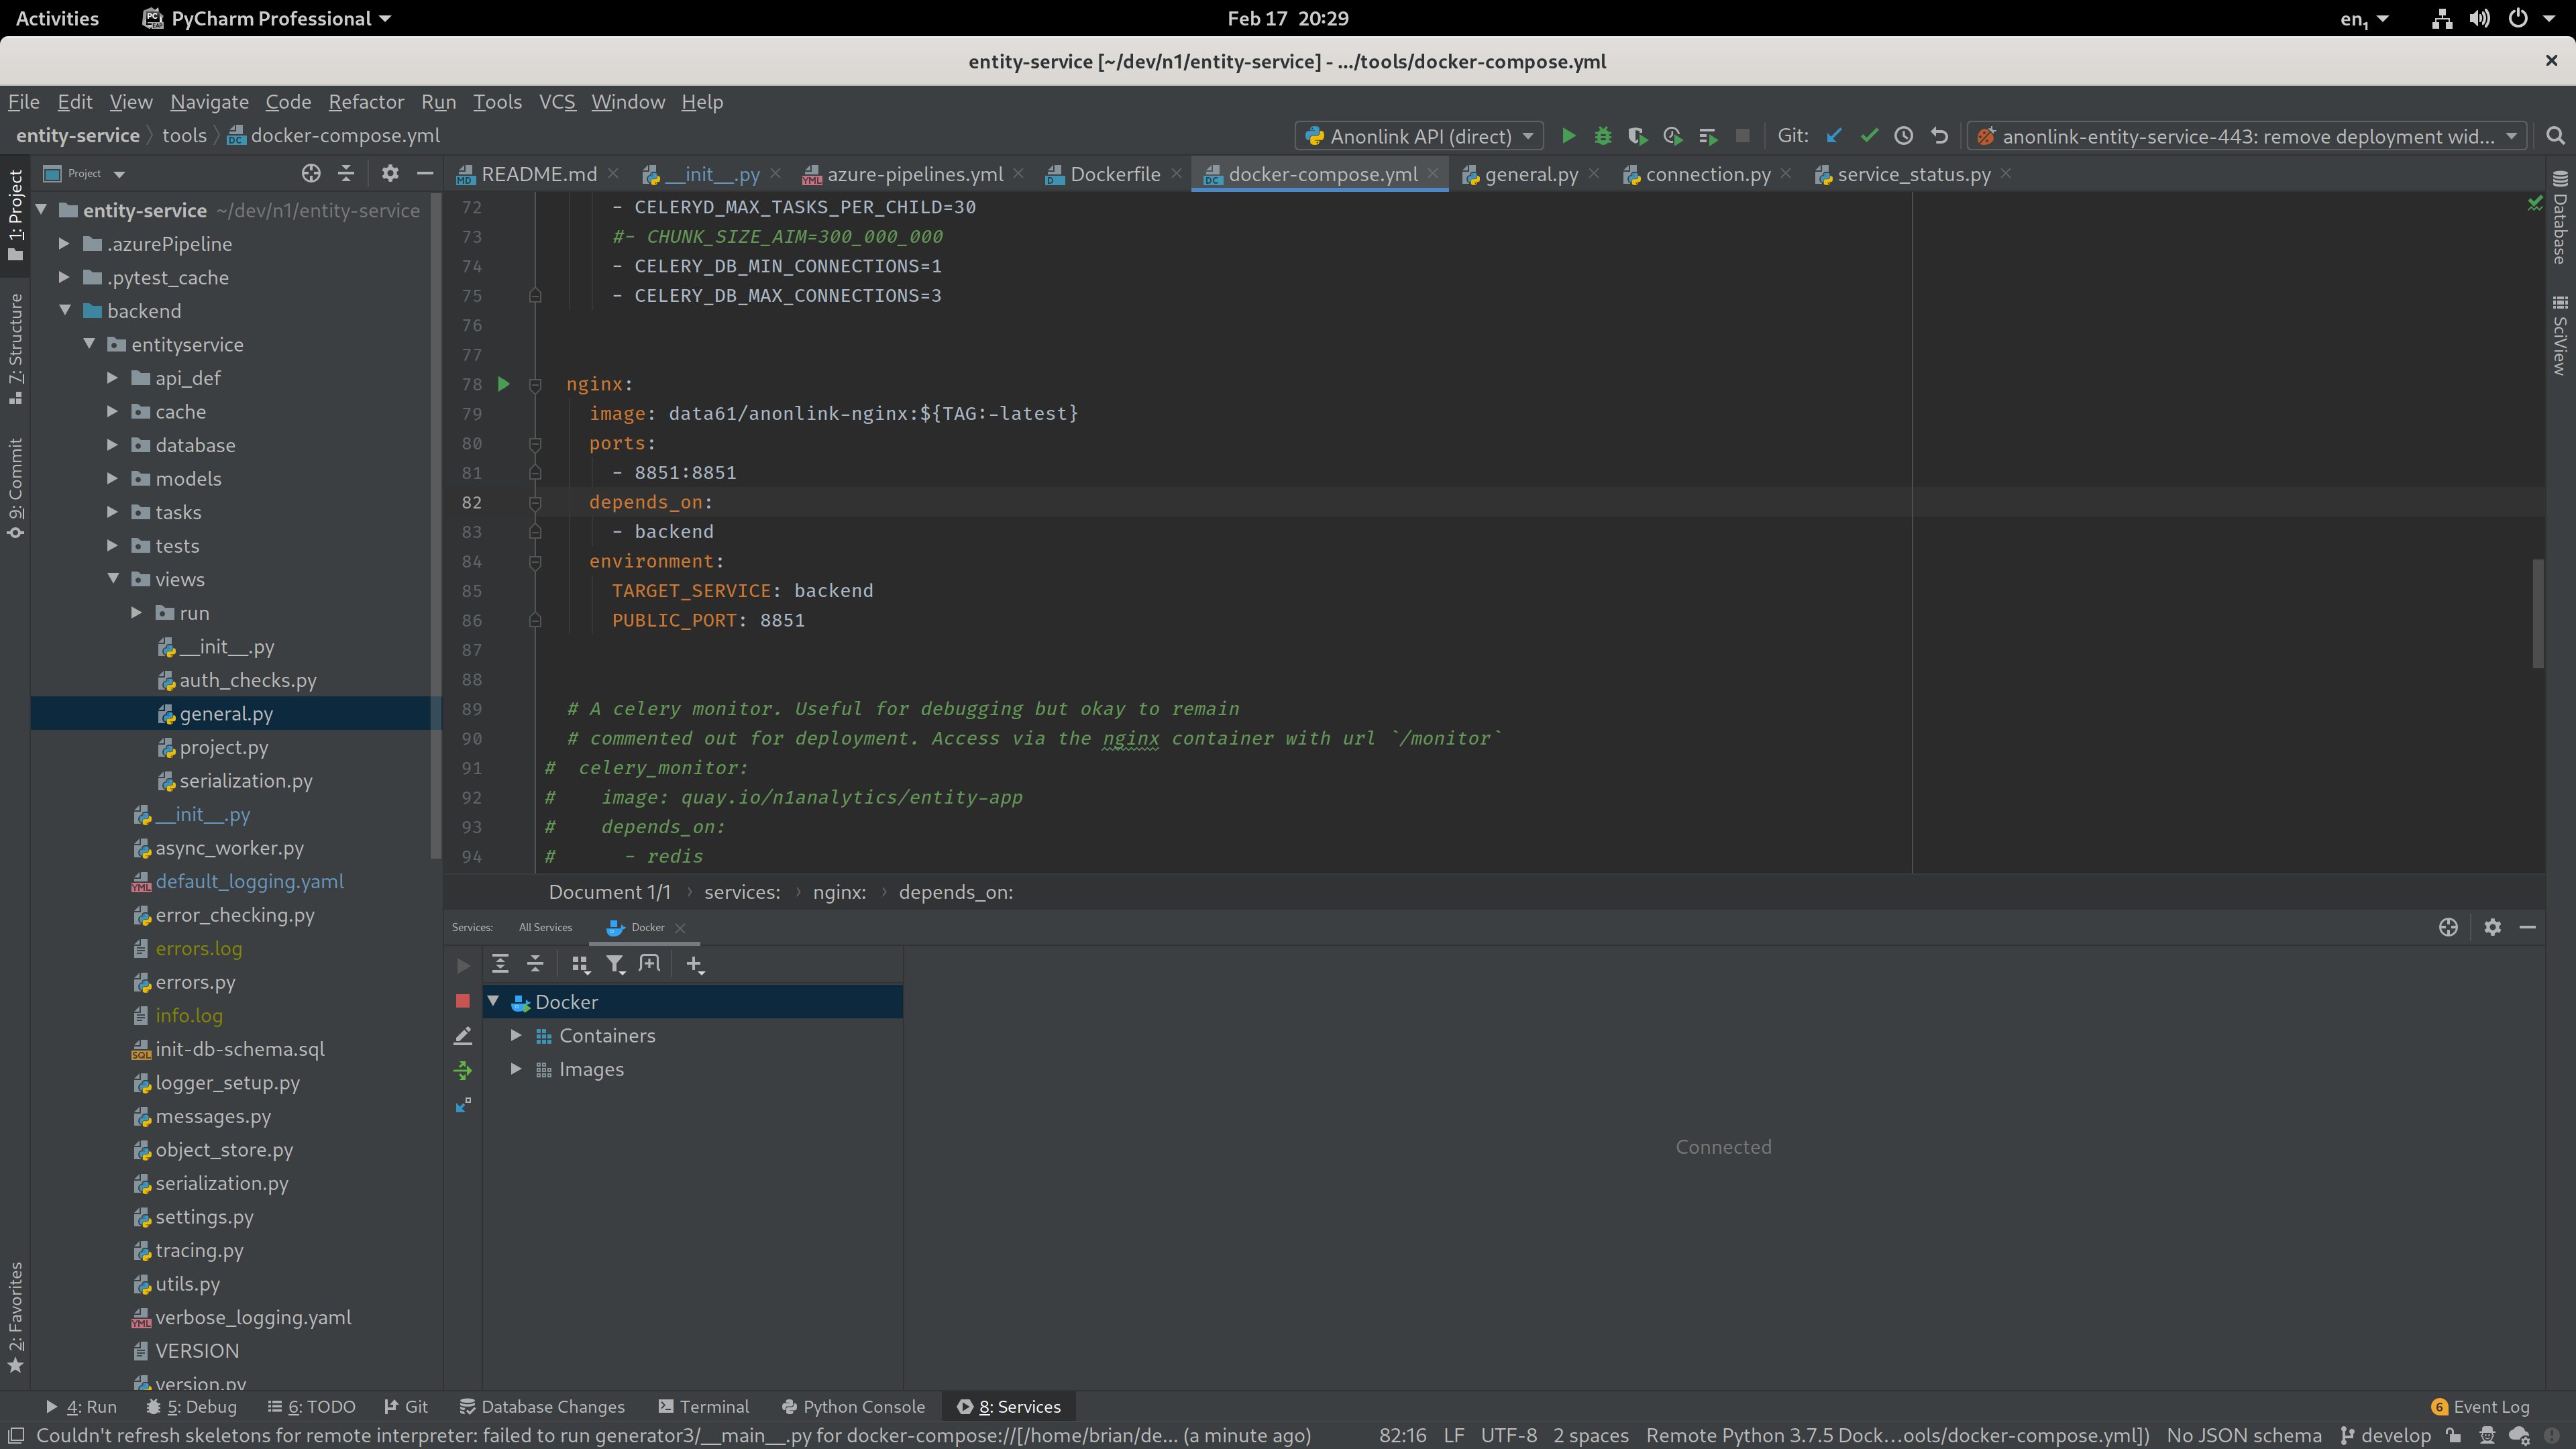
Open the docker-compose file and start the nginx service manually
Note
An alternative would be to expose the port from the backend.
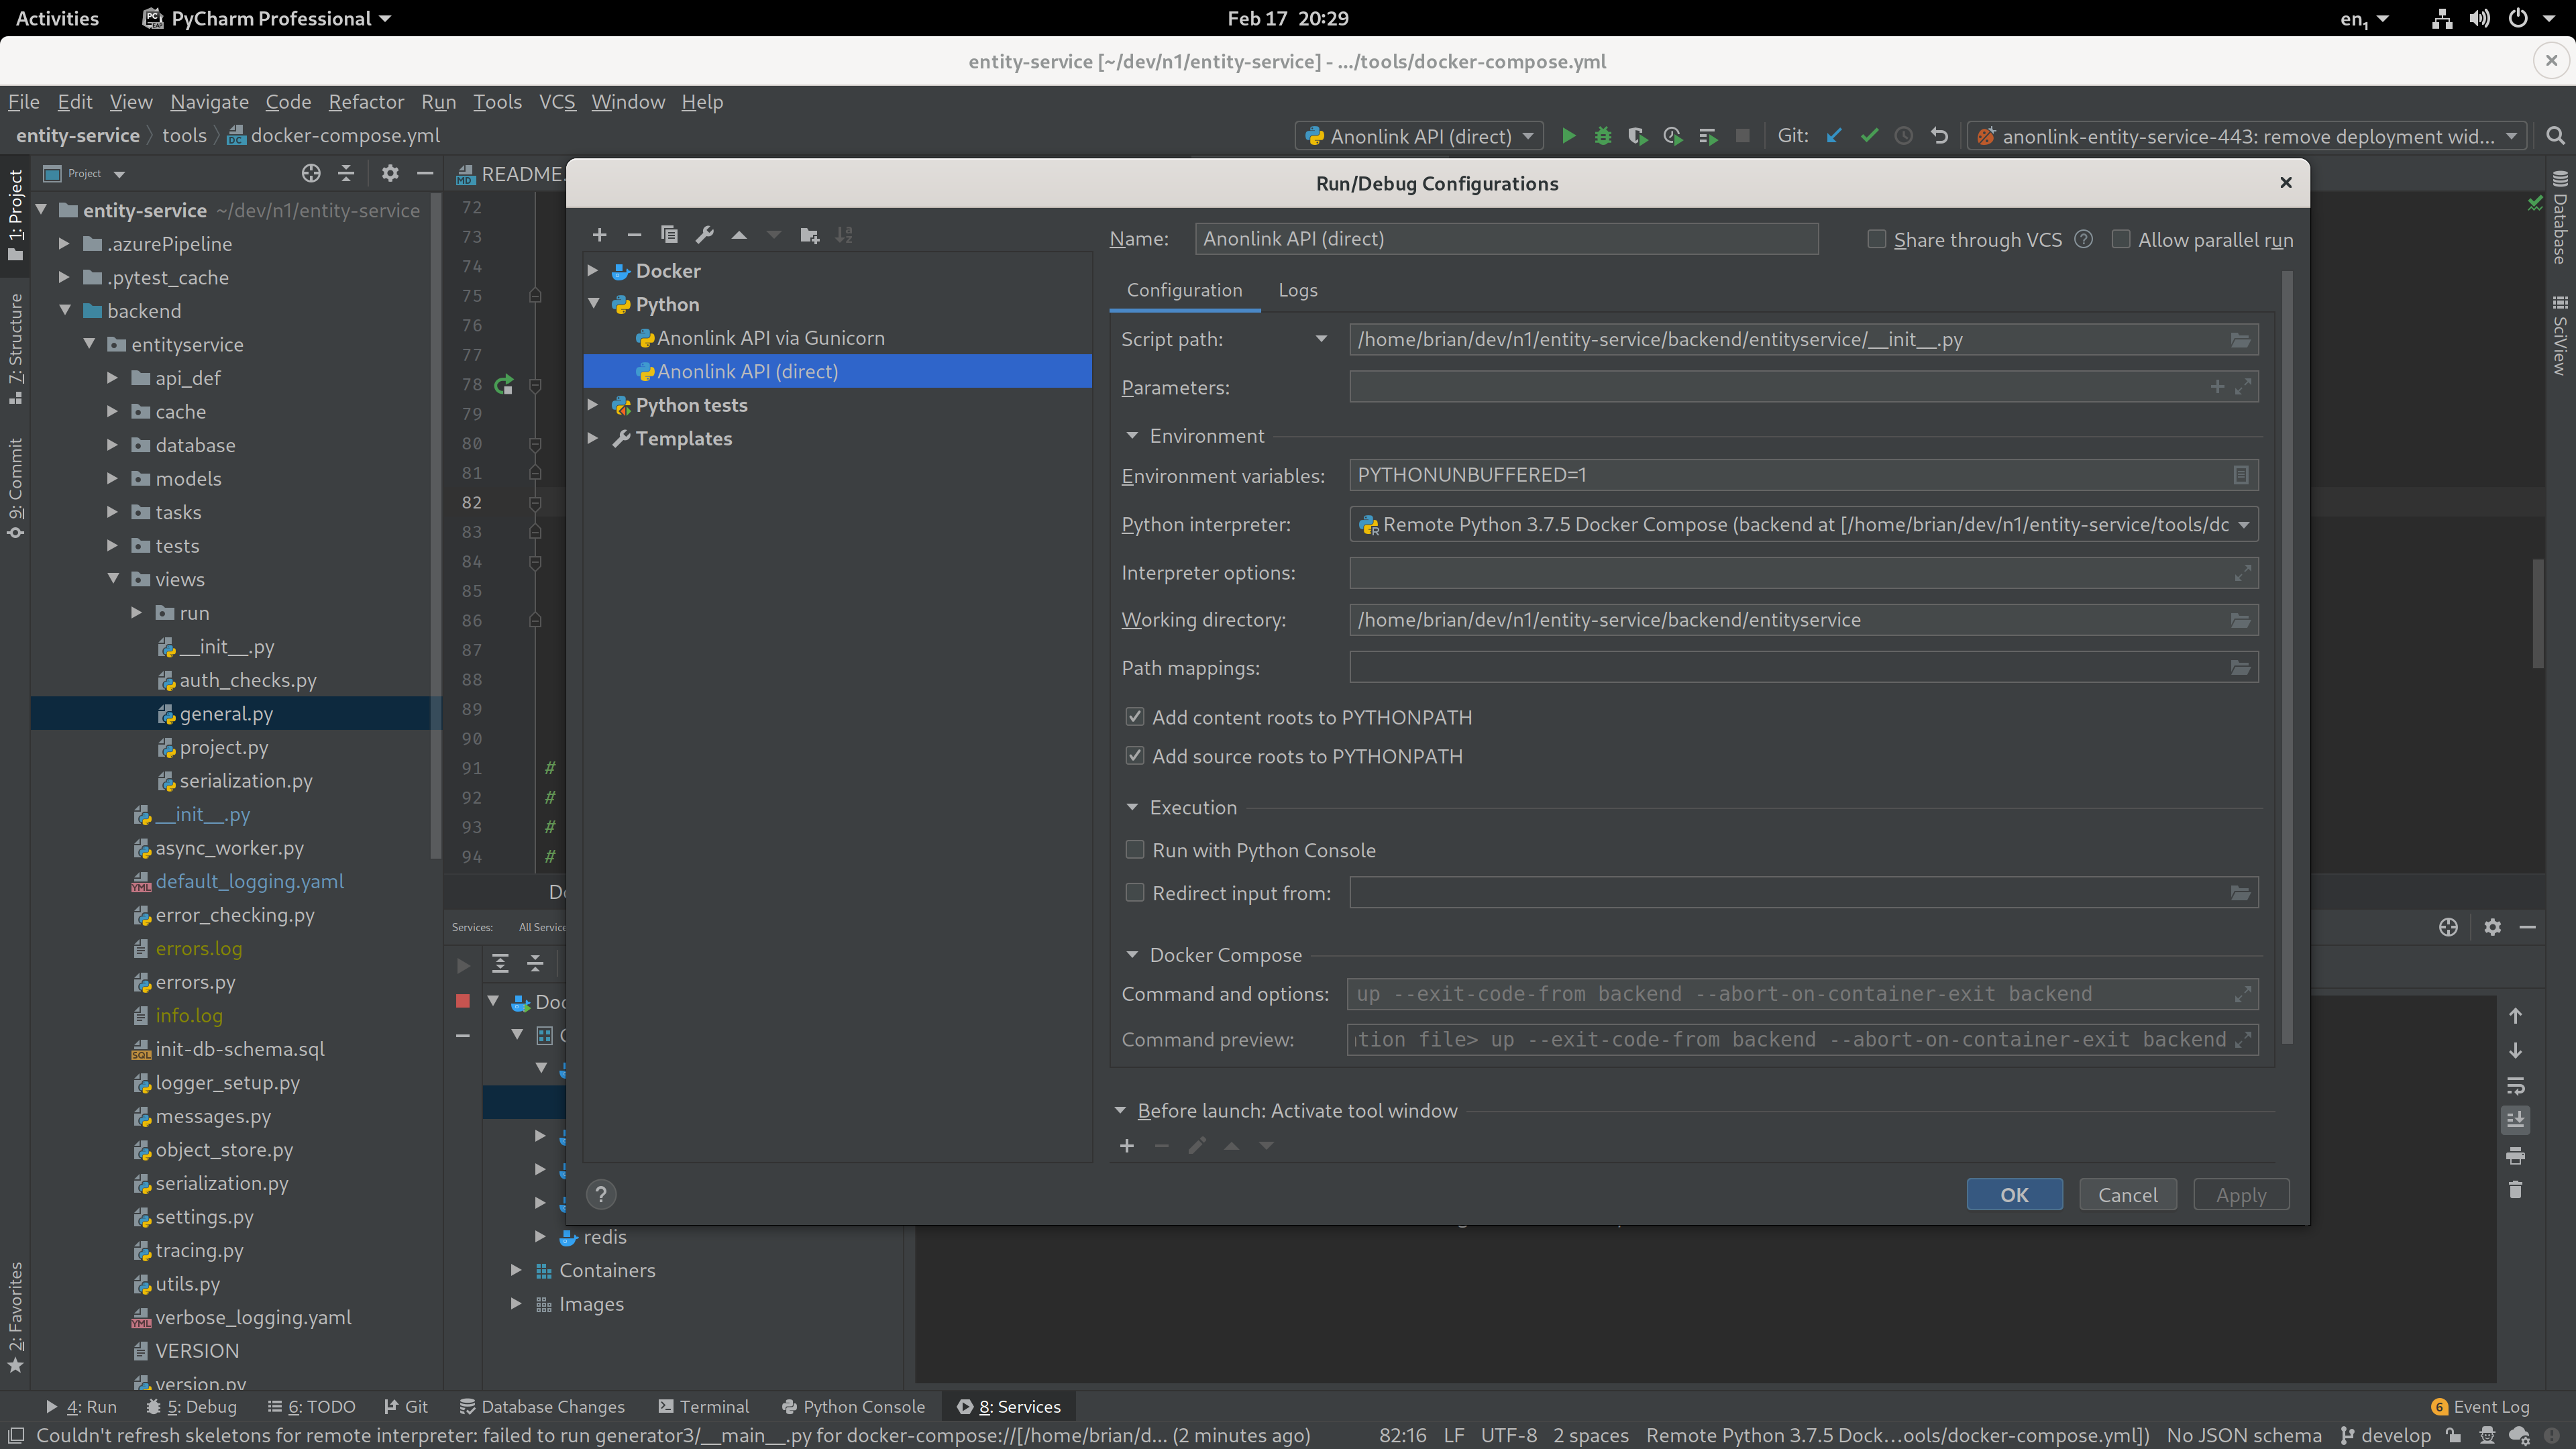
Create a Run Configuration
Create a new Python run configuration for the API. It should default to using the
docker-compose Python interpreter, add the script path to
entityservice._init_.py.
A Python run configuration for running the API service.
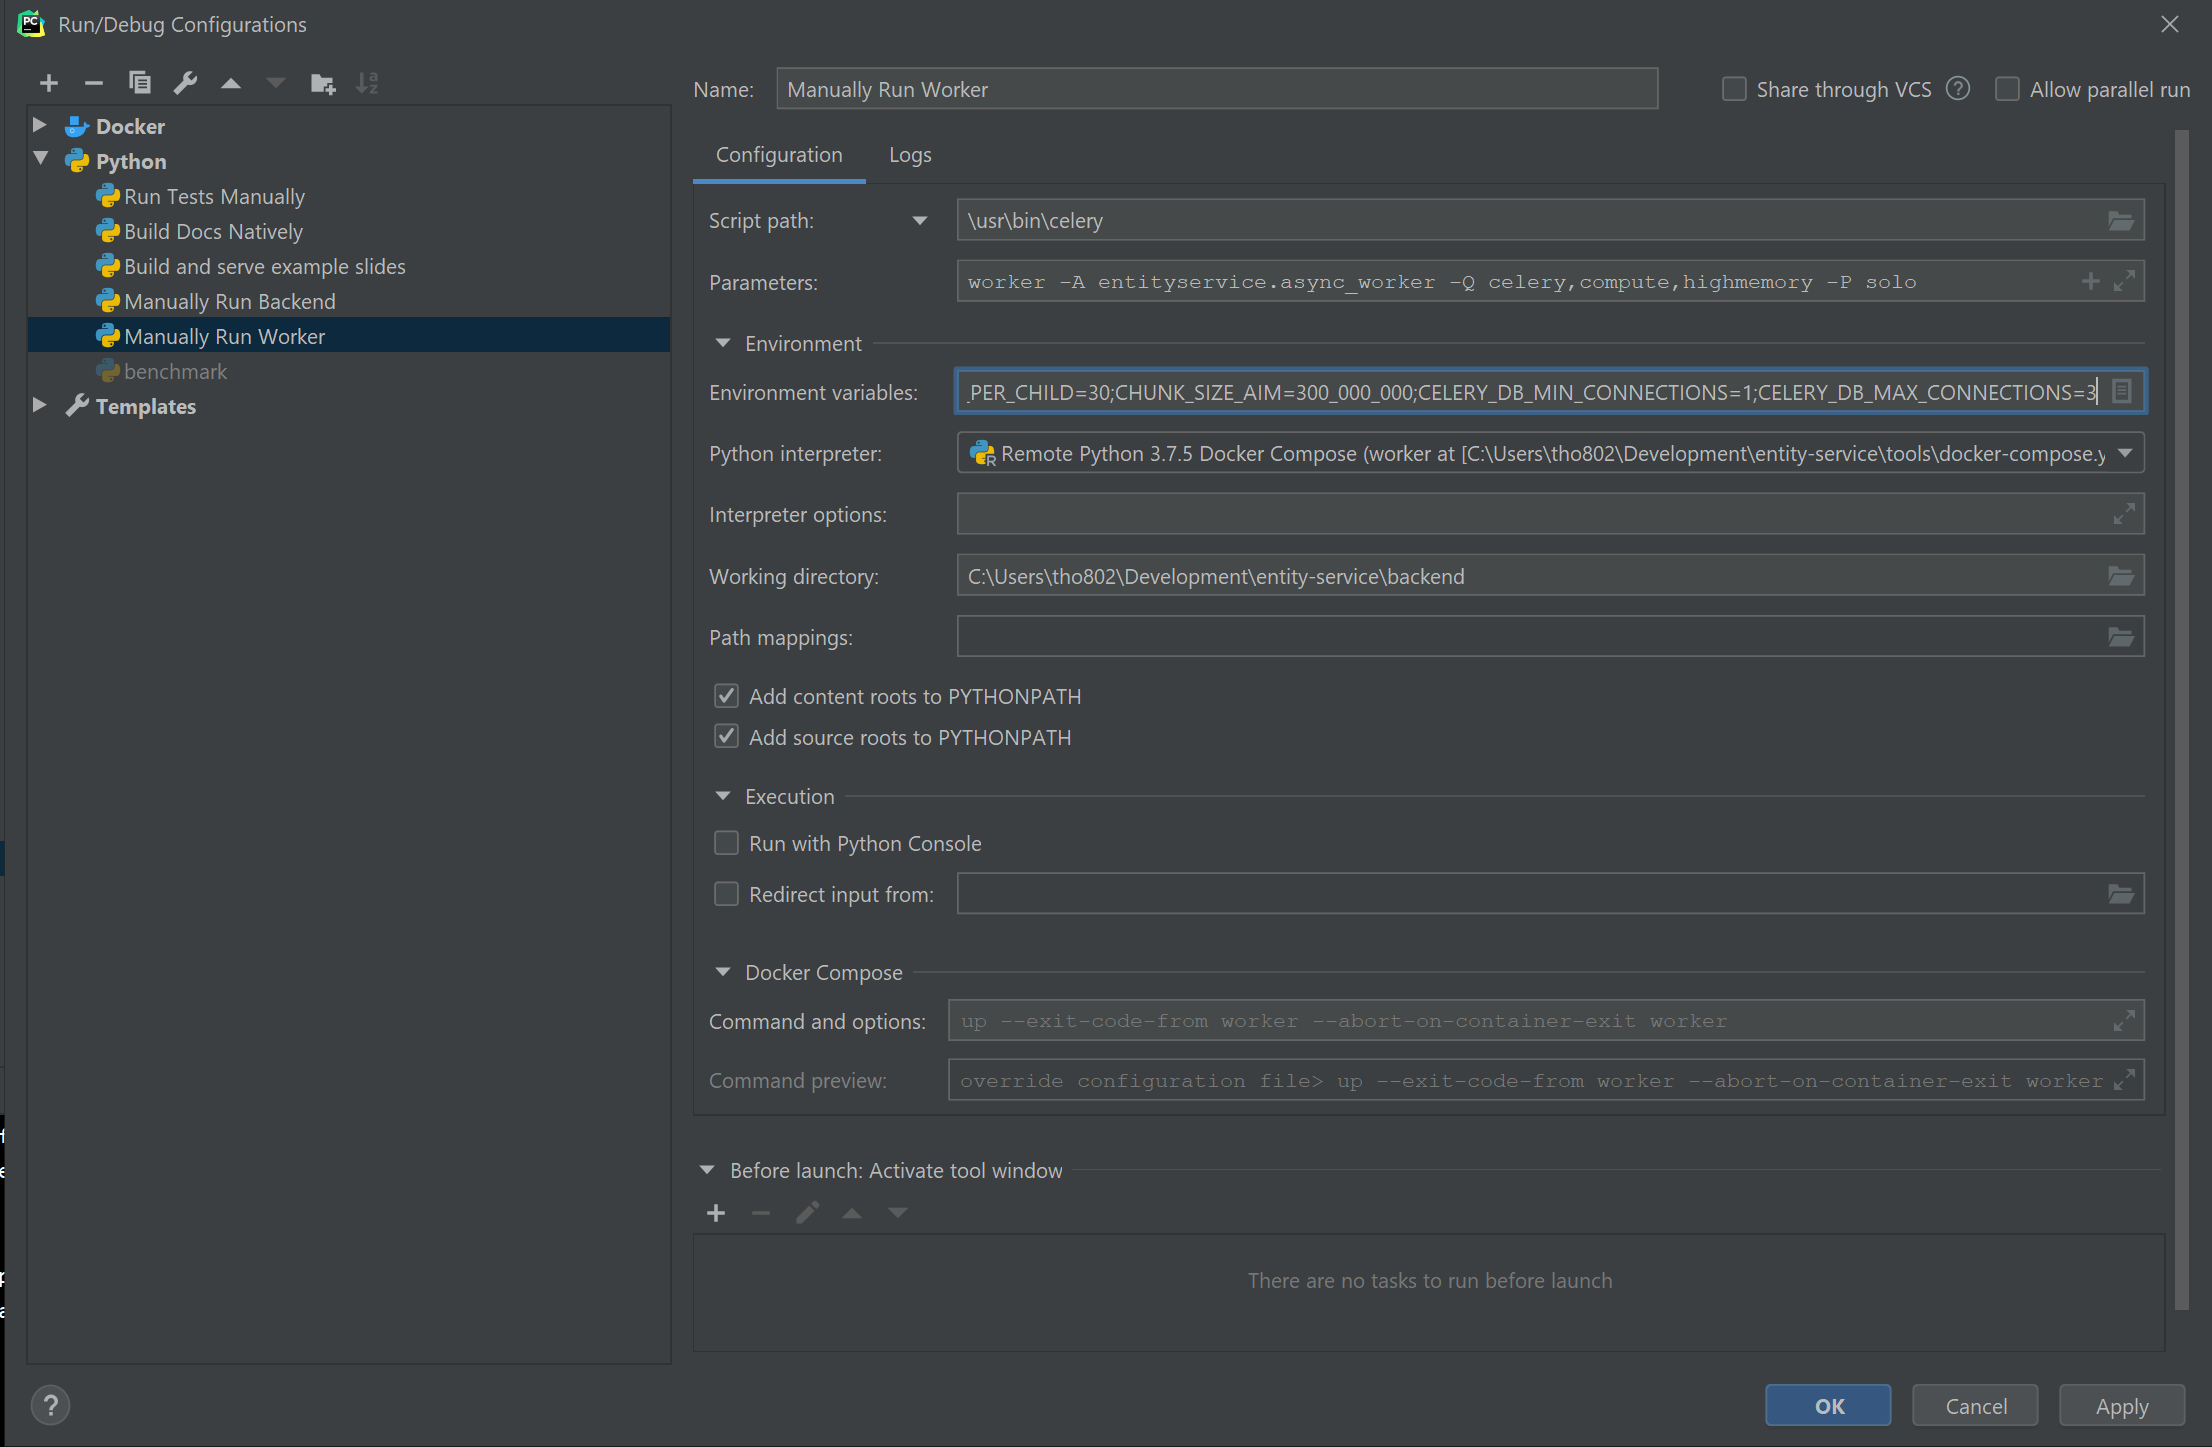
A Python run configuration for running the worker service. Remember to add environment variables from the docker-compose file to ensure the worker can connect to the database, object store and redis.
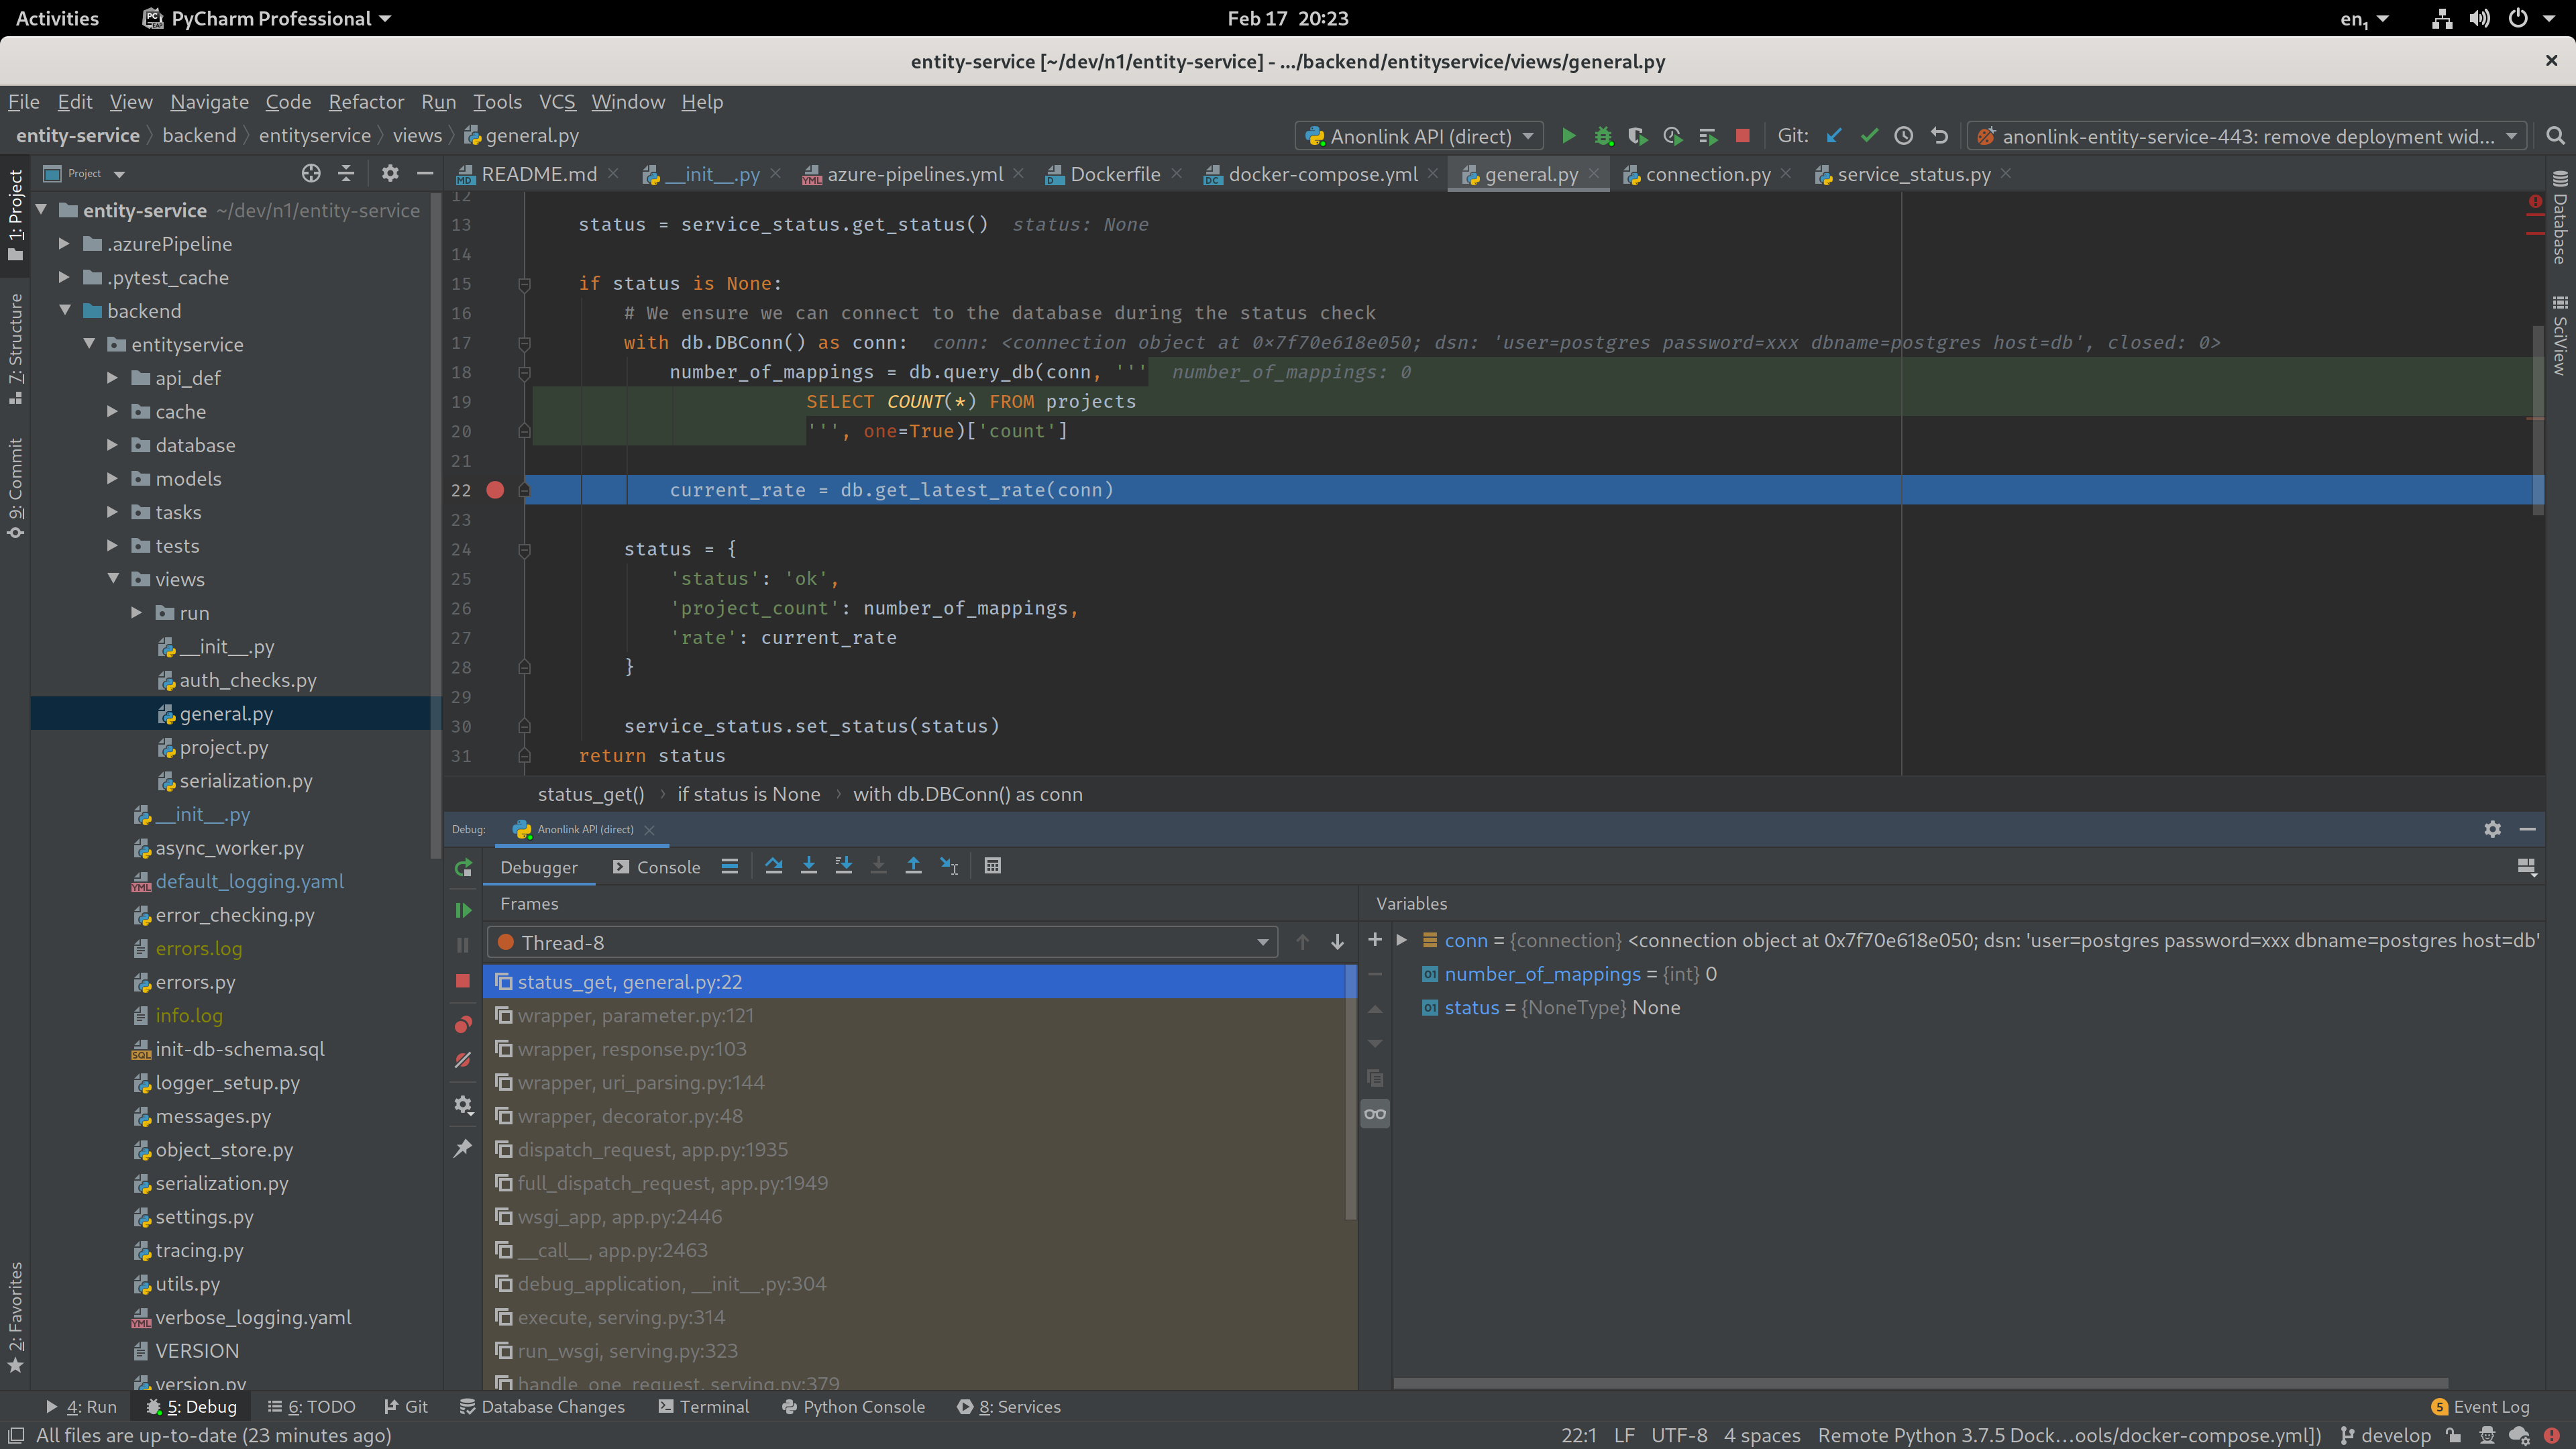
Debug
Add a breakpoint and start debugging!
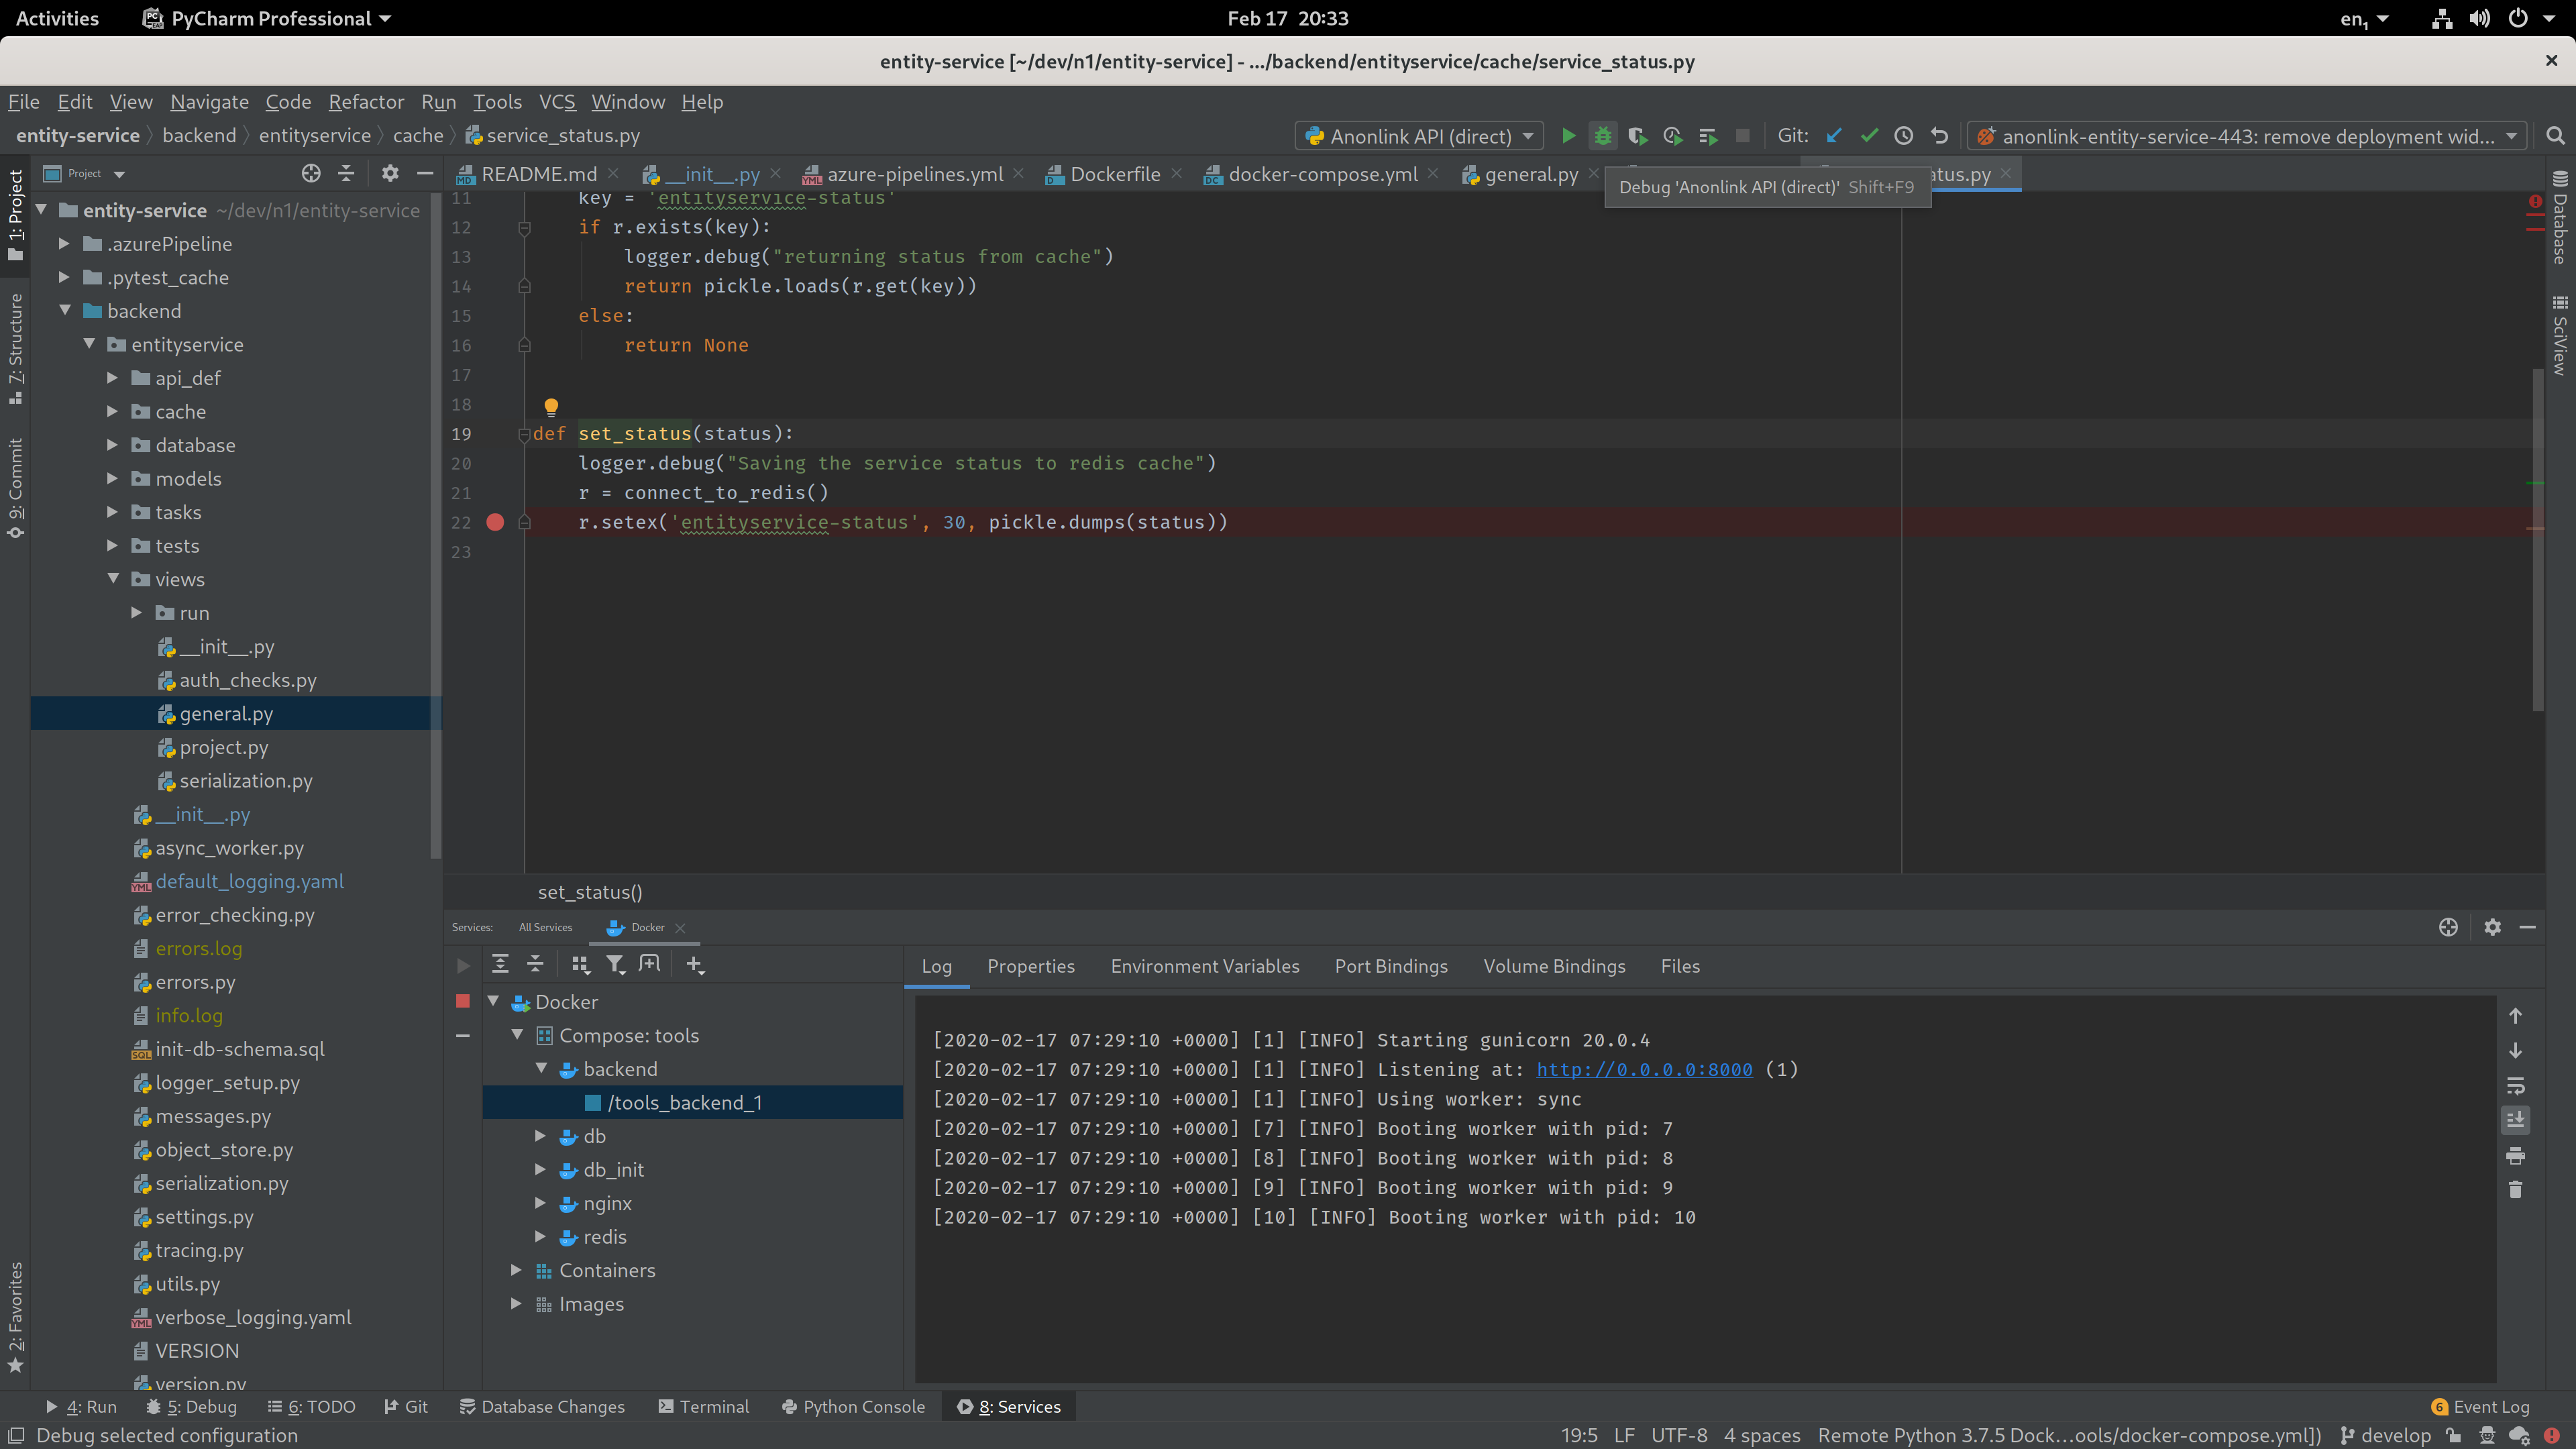
Start running or debugging from PyCharm.
Visit the url in a browser (e.g. http://localhost:8851/api/v1/status) or cause the breakpoint in a notebook or separate unit test etc. If you want the interactive terminal just click “Console” in the debugger and enjoy auto-completion etc:

Interactive debugging console in PyCharm.